Languages in the corpus
For later analysis, the language of texts is of importance. We therefore need statistics of the languages, to later focus on english and german texts.
import pandas as pd
import datetime
import os
import re
import random
import numpy as np
from tqdm import tqdm
from functools import partial
from multiprocessing import  Pool, cpu_count

from matplotlib.backends.backend_pdf import PdfPages
import matplotlib.pyplot as plt
Setup paths
yearBasePath = '/media/arbeit/b88b17b8-b5d7-4c4e-86bc-ff4b67458842/sciGraph/processedData/yeardata/'
yearLinkData = sorted([x for x in os.listdir(yearBasePath) if x.endswith('csv')])
def getNAuthors(row):
    if row:
        return len(row.split(';'))
    else:
        return 0
res = []
for year in tqdm(yearLinkData):
    try:
        dfTemp = pd.read_csv(yearBasePath + year,sep='\t',header=None, low_memory=False)
        dfTemp = dfTemp.rename(columns={0:'year',1:'publicationID',2:'title',3:'language',4:'journalID',5:'journal',6:'hasMPG',7:'authors',8:'affiliation'})
        dfLang = dfTemp.language.value_counts().to_frame().reset_index()
        langCounts = dfLang[dfLang["index"].isin(["['en']", "['de']","['fr']","['it']","['nl']","['ru']"])].set_index('index').to_dict()['language']
        langCounts.update(
            {'year': dfTemp.year.unique()[0],
             'N_pub':dfTemp.shape[0],
             'N_no_aut':dfTemp[dfTemp['authors'].isna()].shape[0],
             'N_no_aff':dfTemp[dfTemp['affiliation'].isna()].shape[0],
             'median authors':dfTemp.authors.fillna('').apply(lambda row: getNAuthors(row)).median()
            })
        res.append(langCounts)
    except pd.errors.ParserError:
        print(year)
100%|██████████| 189/189 [02:00<00:00, 1.57it/s]
df = pd.DataFrame(res)
df.shape
(189, 11)
other = df.fillna(0).apply(lambda row: row['N_pub'] - row["['en']"] - row["['de']"] - row["['ru']"] - row["['fr']"] - row["['it']"],axis=1)
notDeEng = df.fillna(0).apply(lambda row: row['N_pub'] - row["['en']"] - row["['de']"],axis=1)
df.insert(0,'other',other)
df.insert(0,'not_de/eng',notDeEng)
df = df.set_index('year')
df.head(3)
| not_de/eng | other | ['en'] | N_pub | N_no_aut | N_no_aff | median authors | ['fr'] | ['it'] | ['de'] | ['nl'] | ['ru'] | |
|---|---|---|---|---|---|---|---|---|---|---|---|---|
| year | ||||||||||||
| 1832 | 0.0 | 0.0 | 50 | 50 | 10 | 42 | 1.0 | NaN | NaN | NaN | NaN | NaN |
| 1833 | 0.0 | 0.0 | 62 | 62 | 16 | 54 | 1.0 | NaN | NaN | NaN | NaN | NaN |
| 1834 | 1.0 | 1.0 | 55 | 56 | 14 | 43 | 1.0 | NaN | NaN | NaN | NaN | NaN |
| 1835 | 3.0 | 2.0 | 59 | 62 | 14 | 54 | 1.0 | 1.0 | NaN | NaN | NaN | NaN |
| 1836 | 6.0 | 3.0 | 56 | 62 | 12 | 46 | 1.0 | NaN | 3.0 | NaN | NaN | NaN |
| ... | ... | ... | ... | ... | ... | ... | ... | ... | ... | ... | ... | ... |
| 2016 | 24105.0 | 19819.0 | 436896 | 486830 | 27854 | 50266 | 4.0 | 1683.0 | 2596.0 | 25829.0 | 7609.0 | 7.0 |
| 2017 | 30052.0 | 24435.0 | 551611 | 610996 | 36302 | 60672 | 4.0 | 1902.0 | 3704.0 | 29333.0 | 7410.0 | 11.0 |
| 2018 | 30017.0 | 25263.0 | 633293 | 694995 | 39056 | 80009 | 4.0 | 967.0 | 3778.0 | 31685.0 | 7073.0 | 9.0 |
| 2019 | 5821.0 | 4942.0 | 285185 | 302938 | 9249 | 45126 | 4.0 | 210.0 | 665.0 | 11932.0 | 1482.0 | 4.0 |
| NaN | 1.0 | 1.0 | 44 | 45 | 6 | 33 | 3.0 | NaN | NaN | NaN | NaN | NaN |
189 rows × 12 columns
Plots
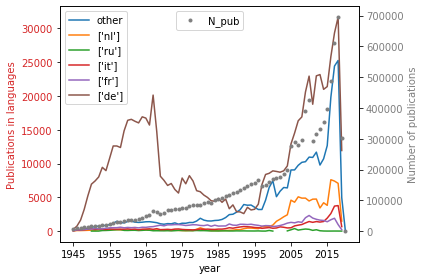
What is the temporal distribution of languages other then english in the corpus?
The rise of netherlands language after 1996 is due to miss-detection of english short texts like book presentations in e.g. Nature.
The same might be true for italian.
with PdfPages('../results/Fig2_MinorLanguages.pdf') as pdffigure:
    fig, ax1 = plt.subplots()

    color = 'tab:red'
    ax1.set_xlabel('year')
    ax1.set_ylabel('Publications in languages', color=color)
    plt1 = df.iloc[113:][['other',"['nl']","['ru']","['it']","['fr']","['de']"]].plot(ax=ax1)
    ax1.tick_params(axis='y', labelcolor=color)
    ax2 = ax1.twinx()
    ax1.legend(loc=0)
    color = 'tab:gray'
    ax2.set_ylabel('Number of publications', color=color)
    plt2 = df.iloc[113:][['N_pub']].plot(ax=ax2,color=color, style='.')
    ax2.tick_params(axis='y', labelcolor=color)
    ax2.legend(loc=9)

    fig.tight_layout()
    pdffigure.savefig(bbox_inches="tight", dpi=400)
    plt.show()
    plt.close()
/home/arbeit/Dokumente/gwdgGitlab/GMPG/gmpg-notebooks/env/lib/python3.8/site-packages/pandas/plotting/_matplotlib/core.py:1235: UserWarning: FixedFormatter should only be used together with FixedLocator
  ax.set_xticklabels(xticklabels)
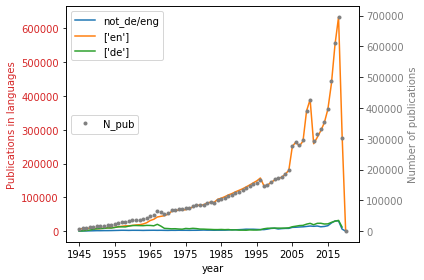
Compare contribution of german to english texts in the corpus, with all other languages as addition.
with PdfPages('../results/Fig3_MajorLanguages.pdf') as pdffigure:
    fig, ax1 = plt.subplots()

    color = 'tab:red'
    ax1.set_xlabel('year')
    ax1.set_ylabel('Publications in languages', color=color)
    plt1 = df.iloc[113:][['not_de/eng',"['en']","['de']"]].plot(ax=ax1)
    ax1.tick_params(axis='y', labelcolor=color)
    ax2 = ax1.twinx()
    ax1.legend(loc=0)
    color = 'tab:gray'
    ax2.set_ylabel('Number of publications', color=color)
    plt2 = df.iloc[113:][['N_pub']].plot(ax=ax2,color=color, style='.')
    ax2.tick_params(axis='y', labelcolor=color)
    ax2.legend(loc=6)

    fig.tight_layout()
    pdffigure.savefig(bbox_inches="tight", dpi=400)
    plt.show()
    plt.close()
/home/arbeit/Dokumente/gwdgGitlab/GMPG/gmpg-notebooks/env/lib/python3.8/site-packages/pandas/plotting/_matplotlib/core.py:1235: UserWarning: FixedFormatter should only be used together with FixedLocator
  ax.set_xticklabels(xticklabels)
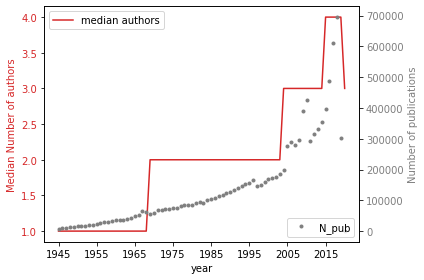
with PdfPages('../results/Fig4_MedianNAuthors.pdf') as pdffigure:
    fig, ax1 = plt.subplots()

    color = 'tab:red'
    ax1.set_xlabel('year')
    ax1.set_ylabel('Median Number of authors', color=color)
    plt1 = df.iloc[113:][['median authors']].plot(ax=ax1, color=color)
    ax1.tick_params(axis='y', labelcolor=color)
    ax2 = ax1.twinx()
    ax1.legend(loc=0)
    color = 'tab:gray'
    ax2.set_ylabel('Number of publications', color=color)
    plt2 = df.iloc[113:][['N_pub']].plot(ax=ax2,color=color, style='.')
    ax2.tick_params(axis='y', labelcolor=color)
    ax2.legend(loc=4)

    fig.tight_layout()
    pdffigure.savefig(bbox_inches="tight", dpi=400)
    plt.show()
    plt.close()
/home/arbeit/Dokumente/gwdgGitlab/GMPG/gmpg-notebooks/env/lib/python3.8/site-packages/pandas/plotting/_matplotlib/core.py:1235: UserWarning: FixedFormatter should only be used together with FixedLocator
  ax.set_xticklabels(xticklabels)