Statistics of metadata
This notebook reads the gathered statstics of each JSONL file to get an overview of the data quality of SciGraph.
import pandas as pd
import os
import numpy as np

from matplotlib.backends.backend_pdf import PdfPages
import matplotlib.pyplot as plt
from tqdm import tqdm
dataPath = '/media/arbeit/b88b17b8-b5d7-4c4e-86bc-ff4b67458842/sciGraph/processedData/'
statPath = dataPath + "stats/"
yearBasePath  = dataPath + "yeardata/"

resultsPath = '../results/'
files = [file for file in os.listdir(statPath)]
yearsList = [x for x in [x for x in os.listdir(yearBasePath)] if x.endswith('csv')]
len(files)
10684
len(yearsList)
189
years = sorted(yearsList)[113:]
years[0]
'1945.csv'
dfs = [pd.read_csv(statPath + file) for file in files]
dfStats = pd.concat(dfs,axis=0)
dfStats.head(2)
| File | N_pub | N_aut_with_MPG | N_pub_with_aut | N_aut | N_aut_with_aff | |
|---|---|---|---|---|---|---|
| 0 | articles_2983.jsonl | 69 | 0.0 | 30.0 | 140.0 | NaN |
| 0 | articles_8197.jsonl | 1370 | 17.0 | 1348.0 | 5595.0 | 5402.0 |
General statistics and MPG contributions
What is the total number of publications in the dataset?
dfStats.N_pub.sum()
11431481
How many publications have information about the authors?
dfStats.N_pub_with_aut.replace('No aut data',0).sum()
10354856.0
What is the number of claimed authorships in the SciGraph dataset?
dfStats.N_aut.sum()
40893845.0
How many of the authorships contain information on the affiliations?
dfStats.N_aut_with_aff.replace('No aff data',0).sum()
37258716.0
How many of these can be directly attributed to the MPG ? (This attribution is by the initial MPG Regular expression)
dfStats.N_aut_with_MPG.sum()
148847.0
Distribution of missing data
For each JSONL file, we calculate the relative difference between publications number and those with author information, the number of authors vs the number of authors with affiliation data, and the percentage of MPG contributions to the overall authors.
def getNdiff(row, p='pub'):
    if p == 'pub':
        try:
            r1 = (row['N_pub'] - row['N_pub_with_aut'])/row['N_pub']
        except:
            r1 = 0
    elif p == 'aff':
        try:
            r1 = (row['N_aut'] - row['N_aut_with_aff'])/row['N_aut']
        except:
            r1 = 0
    elif p == 'mpg':
        try:
            r1 = (row['N_aut_with_MPG']*100)/row['N_aut']
        except:
            r1 = 0
    return r1
r1 = dfStats.apply(lambda row: getNdiff(row,'pub'),axis=1)
r2 = dfStats.apply(lambda row: getNdiff(row,'aff'),axis=1)
r3 = dfStats.apply(lambda row: getNdiff(row,'mpg'),axis=1)
dfStats.insert(0,'diff_N_aut_norm', r1)
dfStats.insert(0,'diff_N_aff_norm', r2)
dfStats.insert(0,'diff_N_mpg_norm', r3)
Historgrams
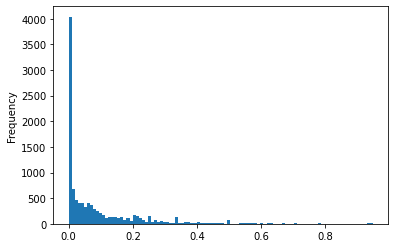
Distribution of differences between publication to publication with authors in each source json. The large majority of JSONL files has author informations for every publication.
dfStats.diff_N_aut_norm.reset_index(drop=True).plot.hist(bins=100)
<AxesSubplot:ylabel='Frequency'>
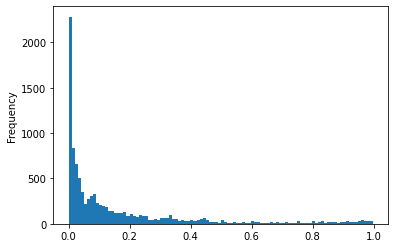
Distribution of the difference between authors to authors with affiliation in each source json. The information about author affiliation is slightly worse.
dfStats.diff_N_aff_norm.reset_index(drop=True).plot.hist(bins=100)
<AxesSubplot:ylabel='Frequency'>
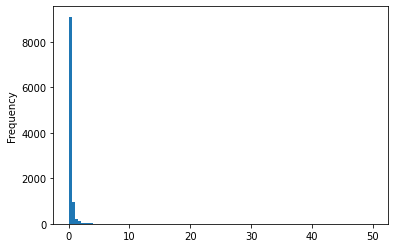
The distribution of percentage of contributions by MPG authors to all authors in each source json. Less then 5 percent is the maximal percentage. Most JSON files contain no MPG authors.
dfStats.diff_N_mpg_norm.reset_index(drop=True).plot.hist(bins=100)
<AxesSubplot:ylabel='Frequency'>
Yearly statistics
Using the files for each year, we create a temporal error distribution.
res = []
for year in tqdm(years):
    ret = {'True':0, 'False':0}
    ret['year'] = year.split('.')[0]
    df = pd.read_csv(yearBasePath + year, sep='\t', header=None)
    #with open(yearBasePath + year, 'r') as file:
    #    data = file.readlines()
    #    lines = [x.strip('\n').split('\t') for x in data]
    #    df = pd.DataFrame(lines)
    #df = pd.read_csv(yearBasePath + year, sep='\t', header=None)
    ret['Npub'] = df.shape[0]
    ret['Nnoaff'] = df[df[8].isna()].shape[0]
    vals = df[6].value_counts().to_dict()
    for key,val in vals.items():
        if key in ['True',True]:
            ret.update({'True':val})
        elif key in ['False',False]:
            ret.update({'False':val})
    res.append(ret)
 36%|███▌      | 27/76 [00:06<00:20,  2.41it/s]/home/arbeit/Dokumente/gwdgGitlab/GMPG/gmpg-notebooks/env/lib/python3.8/site-packages/IPython/core/interactiveshell.py:3145: DtypeWarning: Columns (0,6) have mixed types.Specify dtype option on import or set low_memory=False.
  has_raised = await self.run_ast_nodes(code_ast.body, cell_name,
 89%|████████▉ | 68/76 [01:06<00:25,  3.14s/it]/home/arbeit/Dokumente/gwdgGitlab/GMPG/gmpg-notebooks/env/lib/python3.8/site-packages/IPython/core/interactiveshell.py:3145: DtypeWarning: Columns (0) have mixed types.Specify dtype option on import or set low_memory=False.
  has_raised = await self.run_ast_nodes(code_ast.body, cell_name,
100%|██████████| 76/76 [01:45<00:00,  1.39s/it]
#df
dfSciGraphMeta = pd.DataFrame(res)
dfSciGraphMeta.head(2)
| True | False | year | Npub | Nnoaff | |
|---|---|---|---|---|---|
| 0 | 0 | 6240 | 1945 | 6240 | 5109 |
| 1 | 2 | 8576 | 1946 | 8578 | 6949 |
def getStat(row):
    res1 = (row['True']*100)/row['Npub']
    res2 = row['Npub']/dfSciGraphMeta.Npub.max()
    res3 = (row['Nnoaff']*100)/row['Npub']
    return pd.Series([res1, res2, res3])
percentagePlot = dfSciGraphMeta.set_index('year').apply(lambda row: getStat(row),axis=1).rename(columns={0:'MPG pub', 1:'Rel. pub',2:'No aff data'})
percentagePlot.head(2)
| MPG pub | Rel. pub | No aff data | |
|---|---|---|---|
| year | |||
| 1945 | 0.000000 | 0.008978 | 81.875000 |
| 1946 | 0.023315 | 0.012343 | 81.009559 |
Plotting
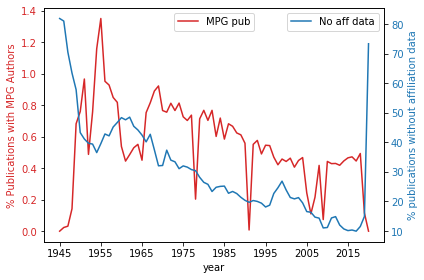
The relative trends of MPG publications to availability of affiliation data.
with PdfPages(resultsPath + 'Fig6_MPG_publications_and_affiliation_data.pdf') as pdffigure:
    fig, ax1 = plt.subplots()
    color = 'tab:red'
    ax1.set_xlabel('year')
    ax1.set_ylabel('% Publications with MPG Authors', color=color)
    plt1 = percentagePlot[['MPG pub']].plot(ax=ax1, color=color)
    ax1.tick_params(axis='y', labelcolor=color)
    ax2 = ax1.twinx()  # instantiate a second axes that shares the same x-axis
    ax1.legend(loc=9)
    color = 'tab:blue'
    ax2.set_ylabel('% publications without affiliation data', color=color)  # we already handled the x-label with ax1
    plt2 = percentagePlot[['No aff data']].plot(ax=ax2,color=color)
    ax2.tick_params(axis='y', labelcolor=color)
    ax2.legend(loc=0)

    fig.tight_layout()  # otherwise the right y-label is slightly clipped
    # Save PDF
    #pdffigure.savefig(bbox_inches="tight", dpi=400)
    plt.show()
    plt.close()
/home/arbeit/Dokumente/gwdgGitlab/GMPG/gmpg-notebooks/env/lib/python3.8/site-packages/pandas/plotting/_matplotlib/core.py:1235: UserWarning: FixedFormatter should only be used together with FixedLocator
  ax.set_xticklabels(xticklabels)
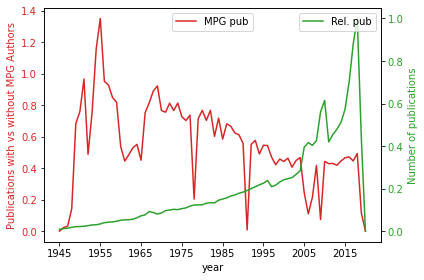
The trends of MPG publications to general publication number in corpus, normed by maximal publication per year (~70tsd).
with PdfPages(resultsPath + 'Fig1_MPG_publications_and_percent_of_all.pdf') as pdffigure:
    fig, ax1 = plt.subplots()

    color = 'tab:red'
    ax1.set_xlabel('year')
    ax1.set_ylabel('Publications with vs without MPG Authors', color=color)
    plt1 = percentagePlot[['MPG pub']].plot(ax=ax1, color=color)
    ax1.tick_params(axis='y', labelcolor=color)
    ax2 = ax1.twinx()  # instantiate a second axes that shares the same x-axis
    ax1.legend(loc=9)
    color = 'tab:green'
    ax2.set_ylabel('Number of publications', color=color)  # we already handled the x-label with ax1
    plt2 = percentagePlot[['Rel. pub']].plot(ax=ax2,color=color)
    ax2.tick_params(axis='y', labelcolor=color)
    ax2.legend(loc=1)

    fig.tight_layout()  # otherwise the right y-label is slightly clipped
    pdffigure.savefig(bbox_inches="tight", dpi=400)
    plt.show()
    plt.close()
/home/arbeit/Dokumente/gwdgGitlab/GMPG/gmpg-notebooks/env/lib/python3.8/site-packages/pandas/plotting/_matplotlib/core.py:1235: UserWarning: FixedFormatter should only be used together with FixedLocator
  ax.set_xticklabels(xticklabels)
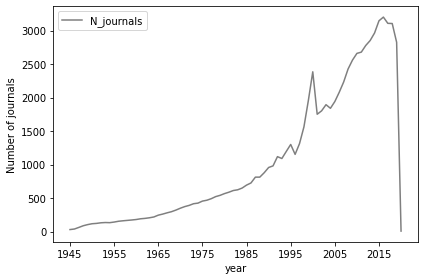
Number of Journals per Year
#sorted(yearsList)
res = []
for corpus in tqdm(sorted(yearsList)):
    year = corpus.split('.')[0]
    df = pd.read_csv(yearBasePath + corpus, sep='\t',header=None)
    res.append({'year':year,'N_journals': len(df[5].unique())})
 74%|███████▍  | 140/189 [00:10<00:15,  3.18it/s]/home/arbeit/Dokumente/gwdgGitlab/GMPG/gmpg-notebooks/env/lib/python3.8/site-packages/IPython/core/interactiveshell.py:3145: DtypeWarning: Columns (0,6) have mixed types.Specify dtype option on import or set low_memory=False.
  has_raised = await self.run_ast_nodes(code_ast.body, cell_name,
 96%|█████████▌| 181/189 [01:02<00:24,  3.03s/it]/home/arbeit/Dokumente/gwdgGitlab/GMPG/gmpg-notebooks/env/lib/python3.8/site-packages/IPython/core/interactiveshell.py:3145: DtypeWarning: Columns (0) have mixed types.Specify dtype option on import or set low_memory=False.
  has_raised = await self.run_ast_nodes(code_ast.body, cell_name,
100%|██████████| 189/189 [01:38<00:00,  1.91it/s]
dfNJournal = pd.DataFrame(res).set_index('year')
with PdfPages(resultsPath + 'Fig5_NumberJournals.pdf') as pdffigure:
    fig, ax1 = plt.subplots()

    color = 'tab:gray'
    ax1.set_xlabel('year')
    ax1.set_ylabel('Number of journals')
    plt1 = dfNJournal.iloc[113:][['N_journals']].plot(ax=ax1, color=color)
    ax1.tick_params(axis='y')
    ax1.legend(loc=0)

    fig.tight_layout()
    # Save as PDF
    #pdffigure.savefig(bbox_inches="tight", dpi=400)
    plt.show()
    plt.close()
/home/arbeit/Dokumente/gwdgGitlab/GMPG/gmpg-notebooks/env/lib/python3.8/site-packages/pandas/plotting/_matplotlib/core.py:1235: UserWarning: FixedFormatter should only be used together with FixedLocator
  ax.set_xticklabels(xticklabels)